| ◀ Previous | TOC | Next ▶ |
2. Pandas入門・シミュレーション
2.1 Pandas
Pandas 準備
Anaconda にはインストールされている.
import pandas as pd でインポート(慣例)
例題 1
次の \(x\), \(y\) それぞれについて, データの平均, 標準偏差, 中央値を求めよ.
種類 |
値 |
|---|---|
x |
1, 2, 3, 6, 4, 2 |
y |
3, 2, 4, 5, 9 |
いろいろな方法があるが, データの利用・加工の観点から Pandas を使うこと.
[1]:
# Example 1
import numpy as np
import pandas as pd


df = pd.DataFrame()  # 空のデータフレームを作成する.
df['x'] = [1, 2, 3, 6, 4, 2]  # カラム 'x' にデータを入れる.
df['y'] = [3, 2, 4, 5, 9, np.NaN] # カラム 'y' にデータを入れる.
# データの長さをそろえる必要があるので, np.NaN を入れてある. NaN = not a number
df  # df を表示する.
[1]:
| x | y | |
|---|---|---|
| 0 | 1 | 3.0 |
| 1 | 2 | 2.0 |
| 2 | 3 | 4.0 |
| 3 | 6 | 5.0 |
| 4 | 4 | 9.0 |
| 5 | 2 | NaN |
[2]:
# Example 1 つづき
df.describe()  # 記述統計を表示
[2]:
| x | y | |
|---|---|---|
| count | 6.000000 | 5.000000 |
| mean | 3.000000 | 4.600000 |
| std | 1.788854 | 2.701851 |
| min | 1.000000 | 2.000000 |
| 25% | 2.000000 | 3.000000 |
| 50% | 2.500000 | 4.000000 |
| 75% | 3.750000 | 5.000000 |
| max | 6.000000 | 9.000000 |
簡単なグラフ
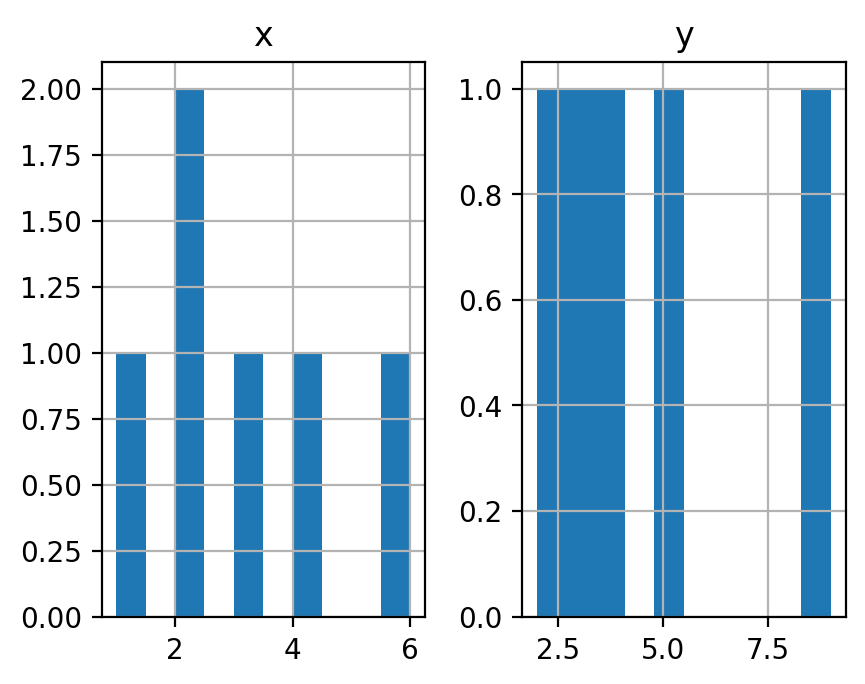
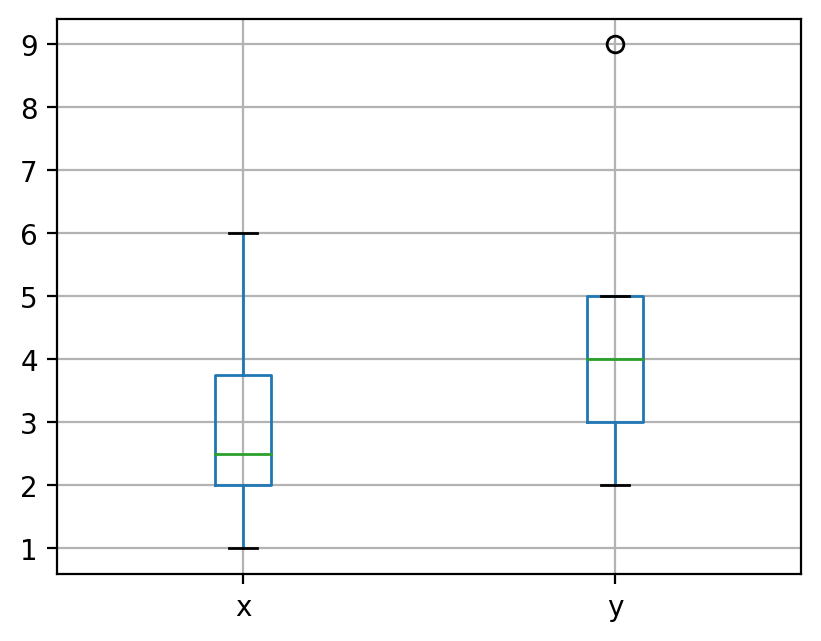
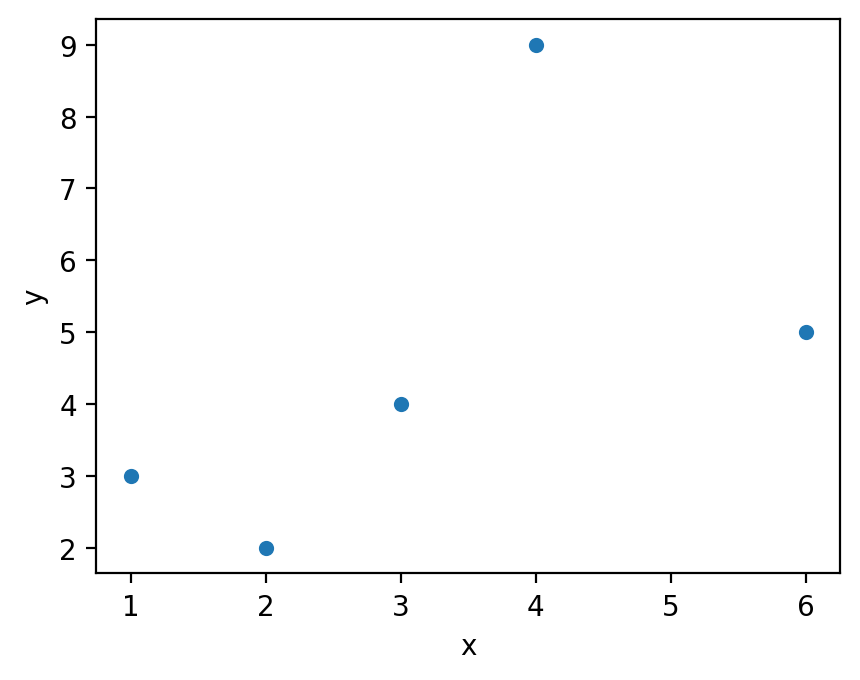
Pandas の DataFrame には, 簡単な統計グラフ表示関数が組み込まれている.
図を表示させるためには, matplotlib.pyplot を import しておいたほうが良いようである.
綺麗な図を描くには, matplotlib.pyplot を直接使ったほうがよさそう.
Matplotlib によるグラフの書き方は例えば, http://t-kawanishi.w3.kanazawa-u.ac.jp/articles/figurehowto_0010_0010.html
[3]:
import matplotlib.pyplot as plt
%matplotlib inline

df.hist()
[3]:
array([[<matplotlib.axes._subplots.AxesSubplot object at 0x11c5dcf60>,
        <matplotlib.axes._subplots.AxesSubplot object at 0x11c321f28>]],
      dtype=object)
[4]:
df.boxplot()
[4]:
<matplotlib.axes._subplots.AxesSubplot at 0x11c576c50>
[5]:
df.plot.scatter('x', 'y')
[5]:
<matplotlib.axes._subplots.AxesSubplot at 0x11c2c42e8>
2.2 シミュレーション
例題 2
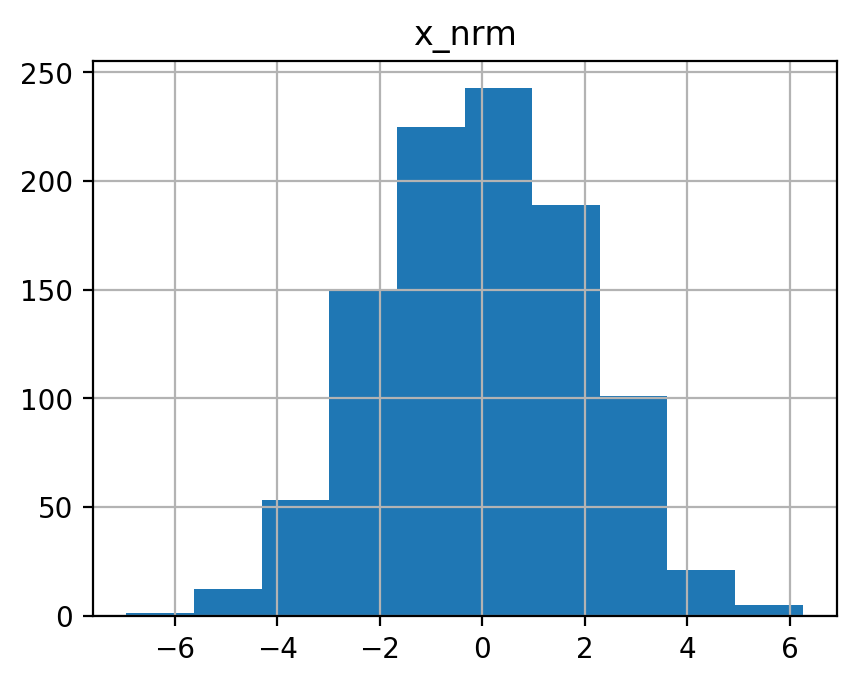
平均 \(\mu = 0\), 分散 \(\sigma^2 = 4\) の正規分布に従う大きさ(サイズ)\(n=100\) の標本を作成し, 次をレポートせよ.
pandas.DataFrame.describe()
ヒストグラム
ランダム・サンプルの生成にはscipy.stats.norm を用いよ.
[2]:
# Example 2
import matplotlib.pyplot as plt
import pandas as pd
import scipy.stats


df2 = pd.DataFrame()
n = 1000
x_nrm = scipy.stats.norm.rvs(loc=0, scale=2, size=n)  # scale^2 = sigma^2
df2['x_nrm'] = x_nrm
df2.describe()
[2]:
| x_nrm | |
|---|---|
| count | 1000.000000 |
| mean | -0.021550 |
| std | 1.976514 |
| min | -6.939586 |
| 25% | -1.420134 |
| 50% | 0.049037 |
| 75% | 1.431627 |
| max | 6.254047 |
[3]:
df2.hist()
[3]:
array([[<matplotlib.axes._subplots.AxesSubplot object at 0x123106c50>]],
      dtype=object)
[4]:
df2.boxplot()
[4]:
<matplotlib.axes._subplots.AxesSubplot at 0x1223e0a58>
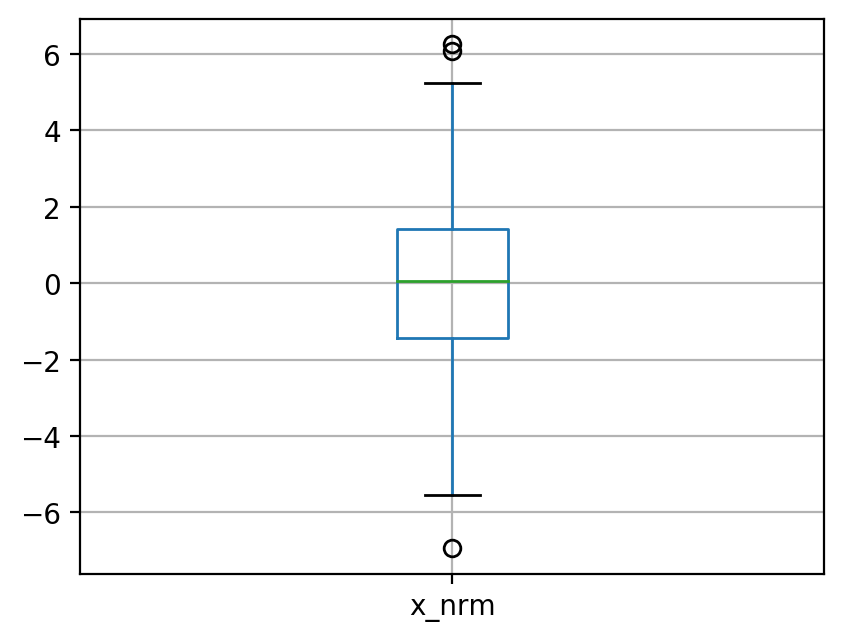
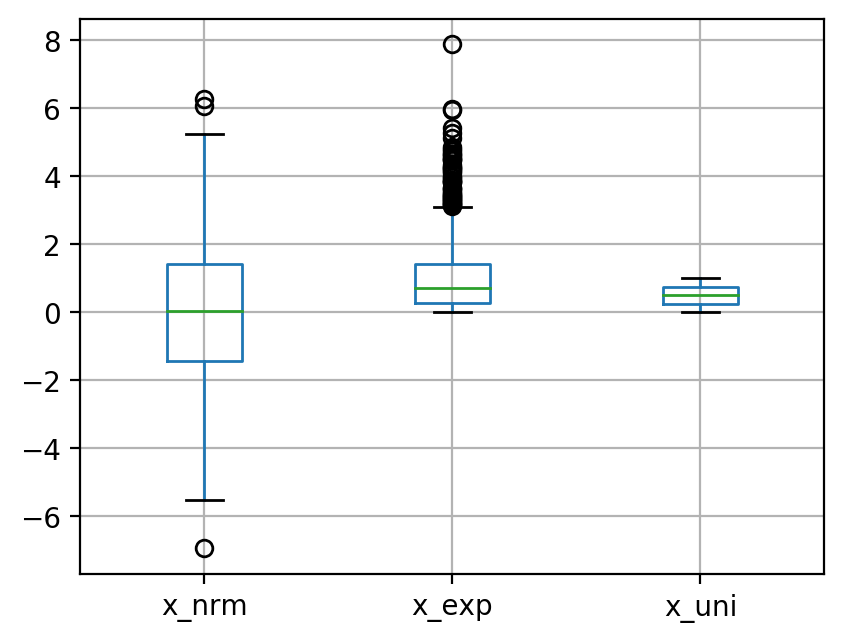
Boxplot(箱ひげ図)
箱は 第 1 四分位数 \(Q_1\) から第 3 四分位数 \(Q_3\) まで
箱の中の線は \(\operatorname{median} = Q_2\)
ひげは, 最大・最小, あるいは, \(Q_1 - 1.5 \times(Q_3 - Q_1)\), \(Q_3 + 1.5 \times (Q_3 - Q_1)\)
[6]:
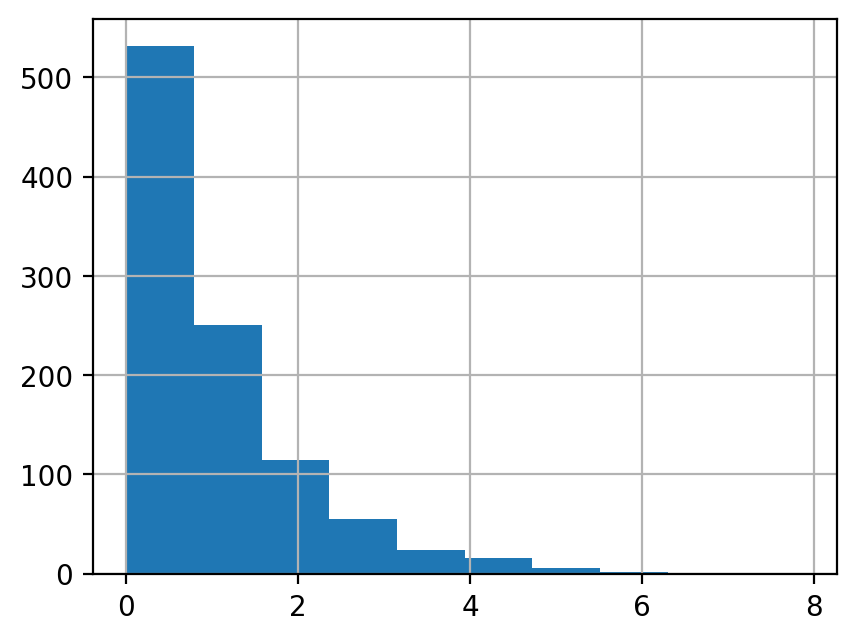
x_exp = scipy.stats.expon.rvs(size=n)
df2['x_exp'] = x_exp
df2['x_exp'].hist()
[6]:
<matplotlib.axes._subplots.AxesSubplot at 0x11fbfa518>
[7]:
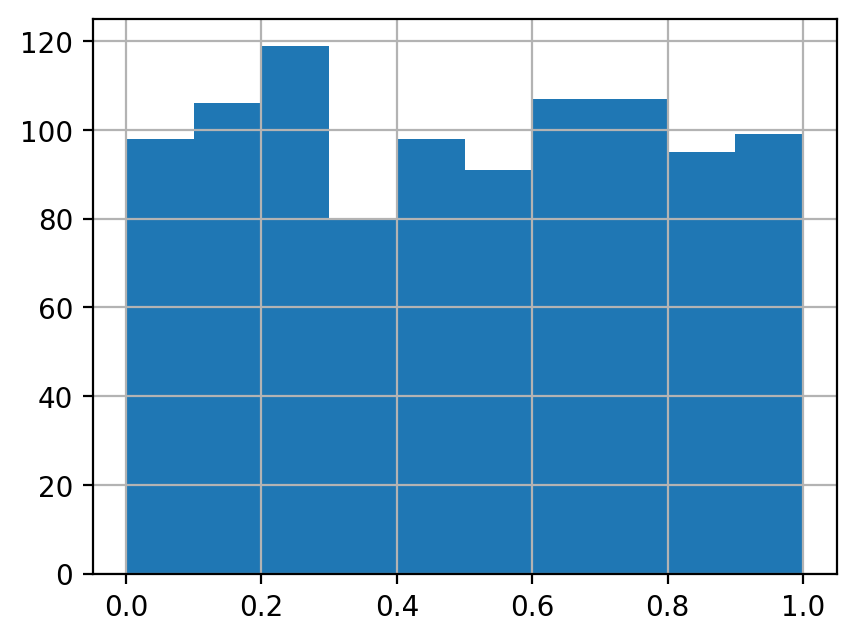
x_uni = scipy.stats.uniform.rvs(size=n)
df2['x_uni'] = x_uni
df2['x_uni'].hist()
[7]:
<matplotlib.axes._subplots.AxesSubplot at 0x11fc320b8>
[8]:
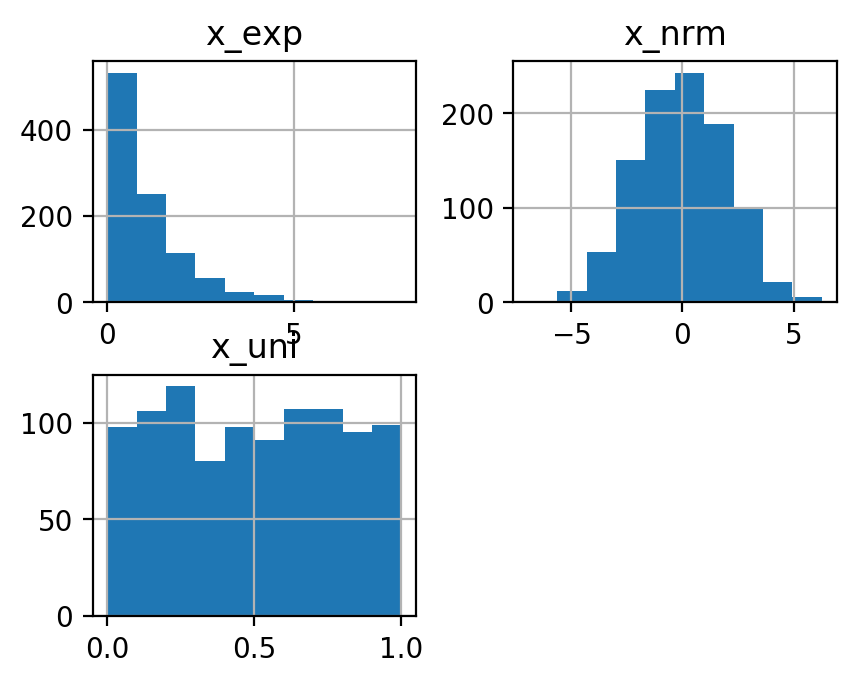
df2.hist()
[8]:
array([[<matplotlib.axes._subplots.AxesSubplot object at 0x12309cb38>,
        <matplotlib.axes._subplots.AxesSubplot object at 0x11d698f28>],
       [<matplotlib.axes._subplots.AxesSubplot object at 0x11d6350b8>,
        <matplotlib.axes._subplots.AxesSubplot object at 0x11d7171d0>]],
      dtype=object)
[9]:
df2.boxplot()
[9]:
<matplotlib.axes._subplots.AxesSubplot at 0x11fa5fbe0>
[10]:
df2.describe()
[10]:
| x_nrm | x_exp | x_uni | |
|---|---|---|---|
| count | 1000.000000 | 1000.000000 | 1000.000000 |
| mean | -0.021550 | 1.034315 | 0.496387 |
| std | 1.976514 | 1.032113 | 0.289432 |
| min | -6.939586 | 0.000586 | 0.000628 |
| 25% | -1.420134 | 0.285190 | 0.233719 |
| 50% | 0.049037 | 0.703160 | 0.499724 |
| 75% | 1.431627 | 1.411834 | 0.746347 |
| max | 6.254047 | 7.874778 | 0.999659 |
[11]:
df2.std(ddof=1) # pandas.DataFrame.describe() の std は 1/(n-1) のほう.
[11]:
x_nrm    1.976514
x_exp    1.032113
x_uni    0.289432
dtype: float64
[12]:
df2.std(ddof=0)
[12]:
x_nrm    1.975525
x_exp    1.031596
x_uni    0.289287
dtype: float64
[13]:
df2.median()
[13]:
x_nrm    0.049037
x_exp    0.703160
x_uni    0.499724
dtype: float64
レポート課題
課題 1
次の 3 つの分布の大きさ \(n=1000\) のランダム・サンプルを作成し, (1) describe() の結果, (2) ヒストグラム, (3) ボックスプロットを求めよ.
平均 \(\mu =1\), 分散 \(\sigma^2 = 1\) の正規分布
平均 \(\mu =2\), 分散 \(\sigma^2 = 4\) の正規分布
Rate parameter \(\lambda = 0.5\) の指数分布
課題 2
Rate parameter (or shape pameter) \(\lambda = 3\) の Poisson 分布に従う大きさ \(n=1000\) のランダム・サンプルを作成し, ヒストグラムとボックスプロットを表示せよ.
| ◀ Previous | TOC | Next ▶ |