| ◀ Previous | TOC |
4. Bootstrap
4.1 標準誤差
中心極限定理により, 標本平均の分布は, 近似的に
\(\bar X_n\) を母平均 \(\mu\) の推定値と考える.
\(\hat \mu\) は近似的に, \(\mathcal N\left(\mu, \frac{\sigma^2}{n}\right)\) に従う.
定義 4.1
標準誤差とは, 母数の推定値の標準偏差である.
例題 4.1
標本サイズ \(n\) の標本平均 \(\bar X\) を \(\mu\) の推定値 \(\hat \mu\) と考えた時, \(\hat \mu\) の標準誤差を求めよ
解答 4.1
\(\hat \mu\) は 近似的に次の分布に従うと考えられる.
ここで, \(\mu\) も \(\sigma^2\) も未知なので, 代わりに \(\hat \mu\), \(S^2\) を用いる.
このため 標準誤差 \(\operatorname{se}\) の推定値 \(\hat {\operatorname{se}}\) を求めることになる.
ここで, \(S^2\) は標本分散.
Remark
\(\operatorname{se}\) の 1.96 倍が, 両側検定 95% の値になる. (\(n\) が十分大きい場合)
Question
標本サイズが大きければ標準誤差を用いて信頼区間を求めて問題ない.
標本サイズが小さければ問題あり.
平均以外の母数の標準誤差は?
例題 4.2
マウスの生存時間, ある処置をした場合としなかった場合.
処置 |
生存時間 |
|---|---|
あり (treated) |
94, 197, 16, 38, 99, 141, 23 |
なし (control) |
52, 104, 146, 10, 51, 30, 40, 27, 46 |
Efron and Tibshirani (1994)
処置ありと処置なしで有意な差があるかを検討する.
処置ありグループ, 処置なしグループ, 及び両者の差の平均値と標準誤差を求めよ.
[2]:
import numpy as np
import pandas as pd

df1 = pd.DataFrame()
df1['treated'] = [94, 197, 16, 38, 99, 141, 23]
df2 = pd.DataFrame()
df2['control'] = [52, 104, 146, 10, 51, 30, 40, 27, 46]
df = pd.concat([df1, df2], axis=1)
df
[2]:
| treated | control | |
|---|---|---|
| 0 | 94.0 | 52 |
| 1 | 197.0 | 104 |
| 2 | 16.0 | 146 |
| 3 | 38.0 | 10 |
| 4 | 99.0 | 51 |
| 5 | 141.0 | 30 |
| 6 | 23.0 | 40 |
| 7 | NaN | 27 |
| 8 | NaN | 46 |
[3]:
print('estimated standard error by std / sqrt(n)')
print(df.std()/np.sqrt(df.count()))
print('estimated standard error by pandas function sem')
print(df.sem())  # standard error of the mean
se_diff = (df['treated'].sem()**2 + df['control'].sem()**2)**0.5
# for difference
m_diff = df['treated'].mean() - df['control'].mean()
print('difference of means = ', m_diff )
print('estimated standard error of the difference of means = ', se_diff)
print('difference / standard error of the difference = ', m_diff / se_diff)
df.describe()
estimated standard error by std / sqrt(n)
treated    25.235490
control    14.158603
dtype: float64
estimated standard error by pandas function sem
treated    25.235490
control    14.158603
dtype: float64
difference of means =  30.63492063492064
estimated standard error of the difference of means =  28.936067136974664
difference / standard error of the difference =  1.0587105873754064
[3]:
| treated | control | |
|---|---|---|
| count | 7.000000 | 9.000000 |
| mean | 86.857143 | 56.222222 |
| std | 66.766830 | 42.475810 |
| min | 16.000000 | 10.000000 |
| 25% | 30.500000 | 30.000000 |
| 50% | 94.000000 | 46.000000 |
| 75% | 120.000000 | 52.000000 |
| max | 197.000000 | 146.000000 |
解答 4.2
処置 |
平均 |
推定標準誤差 |
|---|---|---|
あり |
86.86 |
25.24 |
なし |
56.22 |
14.16 |
差 |
30.63 |
28.93 |
4.2 Bootstrap
ノンパラメトリック・ブートストラップ
得られた標本から重複を許して同じサイズのブートストラップサンプルを再サンプリング (resampling)
例えば, あるサンプル
これから, ブートストラップサンプル \(\boldsymbol x^*\) をとる. 例えば
\(B\) 個の \(\boldsymbol x^*\) が得られる.
添字をつけるときだが, このノートでは, Efron and Tibshirani (1994) にならって, 上付きとする. \(\boldsymbol x^{*1}, \boldsymbol x^{*2}, \dotsc, \boldsymbol x^{*B}\)
\(t\) を統計量(statistics)とする. つまり, \(t\) はデータの関数, \(t(\boldsymbol x)\).
ブートストラップにより, \(B\) 個の \(t(\boldsymbol x^*)\) が得られる.
\(t(\boldsymbol x^{*1}), t(\boldsymbol x^{*2}), \dotsc, t(\boldsymbol x^{*B})\)
まずは, 標本平均でやってみる.
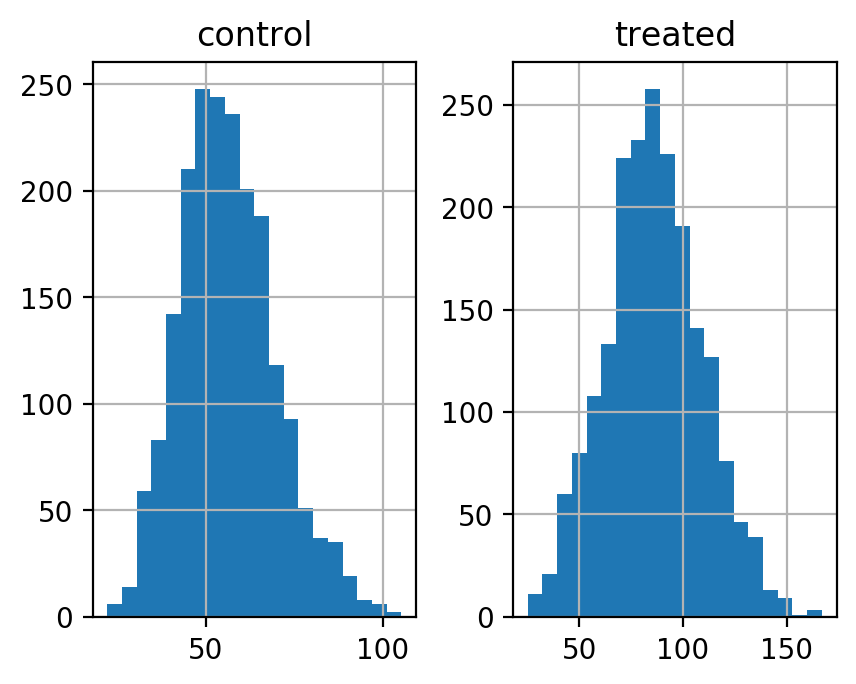
例題 4.3
マウスのデータから, それぞれのグループの(それぞれのサイズの)ブートストラップ・サンプルを \(B=2000\) 個作成し, そのヒストグラムを描け. (bins=20 とする)
ブートストラップによる, 処置あり, なし, ありとなしの差, の生存時間の平均値, 推定標準誤差を求めよ.
平均値の差と「差の推定標準誤差」の比を求めよ.
[16]:
import sys


tr = df['treated']
tr = tr[~np.isnan(tr)]  # NaN を省く.
cn = df['control']
size_tr = len(tr)
size_cn = len(cn)
print('size of tr and cn = ', size_tr, size_cn)
b = 2000
ms = []
ms_cn = []
for i in range(b):
    btr = np.random.choice(tr, size=size_tr)
    # print(btr)
    # sys.exit()
    m = btr.mean()
    ms.append(m)
    bcn = np.random.choice(cn, size=size_cn)
    m_cn = bcn.mean()
    ms_cn.append(m_cn)
ms = np.array(ms)
ms_cn = np.array(ms_cn)

dfm = pd.DataFrame()
dfm['treated'] = ms
dfm['control'] = ms_cn
dfm.hist(bins=20)
size of tr and cn = 7 9
[16]:
array([[<matplotlib.axes._subplots.AxesSubplot object at 0x12417af28>,
        <matplotlib.axes._subplots.AxesSubplot object at 0x12495fef0>]],
      dtype=object)

平均値の分布の形がシミュレートできるので, 正規分布近似よりは正確になることが期待できる.
いつもそうだとは限らない.
[4]:
mms = ms.mean()
mms_cn = ms_cn.mean()

print('bootstrap estimate of the population means = ',  mms, mms_cn)

sqs_tr = np.sum( (ms - mms)**2 )
se_boot_tr = (sqs_tr / (b - 1))**.5
print(se_boot_tr)

sqs_cn = np.sum( (ms_cn - mms_cn)**2 )
se_boot_cn = (sqs_cn / (b - 1))**.5
print(se_boot_cn)

se_boot_difference = (se_boot_tr**2 + se_boot_cn**2)**.5
print(se_boot_difference)

print(' 処置  平均値    推定標準誤差')
print(' あり  {:.2f}   {:.2f}'.format(mms, se_boot_tr))
print(' なし  {:.2f}   {:.2f}'.format(mms_cn, se_boot_cn))
print(' 差   {:.2f}   {:.2f}'.format(mms - mms_cn, se_boot_difference))
print(' 差/推定標準誤差  {:.2f}'.format((mms - mms_cn)/se_boot_difference))
bootstrap estimate of the population means =  87.3985 55.97711111111111
22.867823466576755
13.139261912602885
26.37380430856526
 処置  平均値    推定標準誤差
 あり  87.40   22.87
 なし  55.98   13.14
 差   31.42   26.37
 差/推定標準誤差  1.19
レポート課題
課題 1
例題 4.2 のマウスのデータで, 平均値の代わりに中央値をとるとどのようになるか.
ブートストラップによる中央値の標準誤差(処置あり, なし, ありとなしの差)を求めよ.
ブートストラップサンプル数 \(B = 50\) と \(B = 2000\) の場合について計算せよ.
元のサンプルの中央値の差と、ブートストラップによる中央値の差の標準誤差の比を求めよ.
median of array a = np.median(a), not a.median()
| ◀ Previous | TOC |