| ◀ Previous | TOC | Next ▶ |
3. データとグラフ・Pandas と Matplotlib
参考資料
http://t-kawanishi.w3.kanazawa-u.ac.jp/articles/figurehowto_0010_0010.html
Web 上には優れたチュートリアル(日本語)がたくさんある.
3.1 Pandas
Pandas のインポート
[1]:
import numpy as np
import pandas as pd
DataFrame の作成
いろいろなやり方がある.
Pandas は データサイエンスの事実上の標準のひとつ.
いろいろ試して慣れることが大切.
[4]:
xs = [1.2, 2.3, 3.1, 4.5, 5.0]
ys = [2.0, 3.1, 1.3, 2.8, 4.1]
a

df = pd.DataFrame()  # DataFrame オブジェクトを作成
df['x'] = xs
df['y'] = ys
#print(df)
df
[4]:
| x | y | |
|---|---|---|
| 0 | 1.2 | 2.0 |
| 1 | 2.3 | 3.1 |
| 2 | 3.1 | 1.3 |
| 3 | 4.5 | 2.8 |
| 4 | 5.0 | 4.1 |
Try
df
instead of print(df)
データの保存
[5]:
df.to_csv('test20191224.csv')
[6]:
# cat test20191224.csv
データの読み込み
[6]:
dfread = pd.read_csv('test20191224.csv')
dfread
[6]:
| Unnamed: 0 | x | y | |
|---|---|---|---|
| 0 | 0 | 1.2 | 2.0 |
| 1 | 1 | 2.3 | 3.1 |
| 2 | 2 | 3.1 | 1.3 |
| 3 | 3 | 4.5 | 2.8 |
| 4 | 4 | 5.0 | 4.1 |
Something is wrong
Try the following
行インデックスが二重になっている.
つぎのようにしてみよう.
[7]:
df.to_csv('test20191224.csv', index=None)
[8]:
dfread = pd.read_csv('test20191224.csv')
dfread
[8]:
| x | y | |
|---|---|---|
| 0 | 1.2 | 2.0 |
| 1 | 2.3 | 3.1 |
| 2 | 3.1 | 1.3 |
| 3 | 4.5 | 2.8 |
| 4 | 5.0 | 4.1 |
簡単な統計
[9]:
df.describe()
[9]:
| x | y | |
|---|---|---|
| count | 5.000000 | 5.000000 |
| mean | 3.220000 | 2.660000 |
| std | 1.561089 | 1.069112 |
| min | 1.200000 | 1.300000 |
| 25% | 2.300000 | 2.000000 |
| 50% | 3.100000 | 2.800000 |
| 75% | 4.500000 | 3.100000 |
| max | 5.000000 | 4.100000 |
平均
[10]:
print(df.mean())
x    3.22
y    2.66
dtype: float64
分散
[11]:
print(df.var())
x    2.437
y    1.143
dtype: float64
[12]:
dfstat = pd.DataFrame()
dfstat['mean'] = df.mean()
dfstat['var'] = df.var()
dfstat
[12]:
| mean | var | |
|---|---|---|
| x | 3.22 | 2.437 |
| y | 2.66 | 1.143 |
3.2 Matplotlib
Matplotlib, pyplot のインポート
[13]:
# from matplotlib import pyplot as plt
import matplotlib.pyplot as plt
%matplotlib inline
# plt.show()
[14]:
print(df.columns) # 列(カラム)のインデックスを表示
Index(['x', 'y'], dtype='object')
[19]:
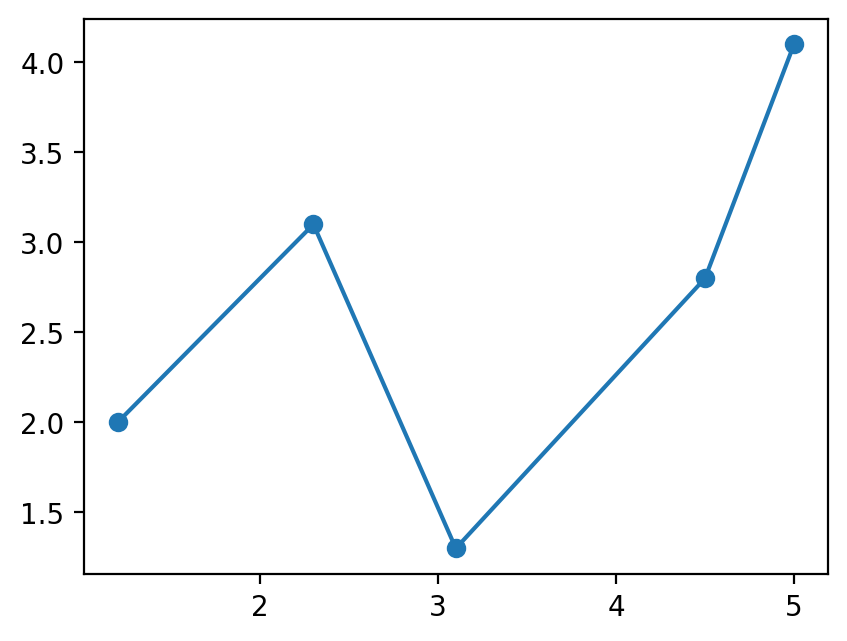
fig, ax = plt.subplots()
ax.plot(df['x'], df['y'], marker='o')
[19]:
[<matplotlib.lines.Line2D at 0x11ea284a8>]

[20]:
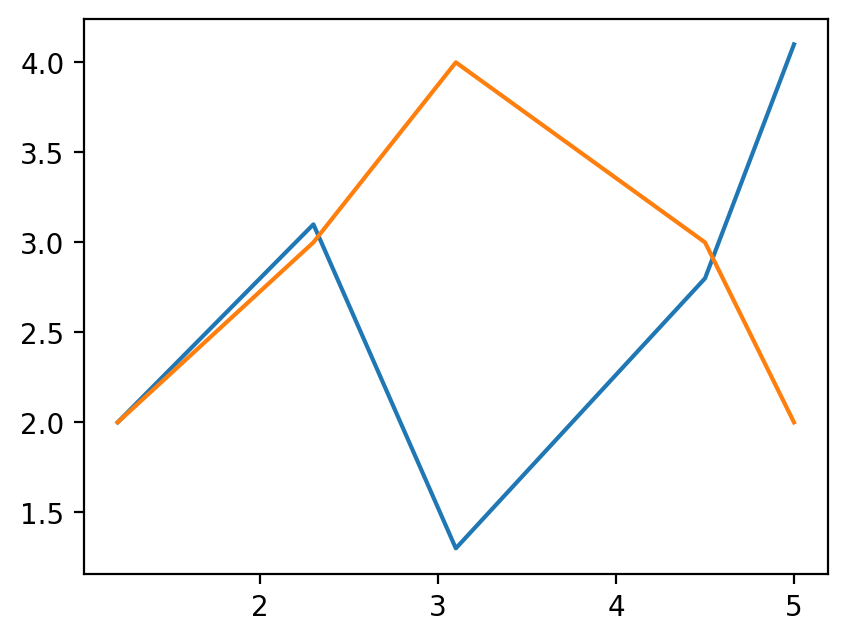
# 2つ以上のプロットも簡単に描ける.

y2s = [2, 3, 4, 3, 2]

figa, axa = plt.subplots()
axa.plot(df['x'], df['y'])
axa.plot(df['x'], y2s)
[20]:
[<matplotlib.lines.Line2D at 0x11ea59160>]

[21]:
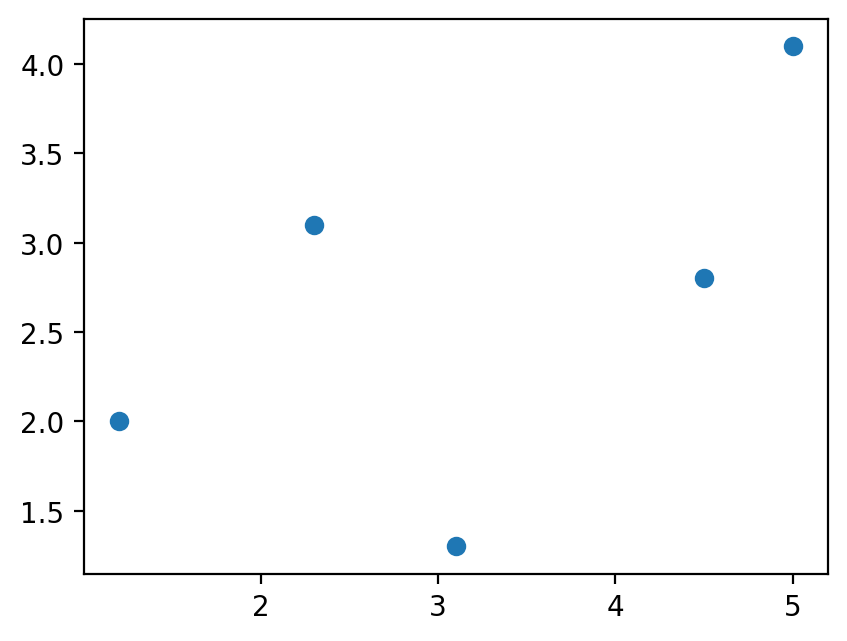
# 散布図

fig1, ax1 = plt.subplots()
ax1.scatter(df['x'], df['y'])
[21]:
<matplotlib.collections.PathCollection at 0x11eaba470>

[22]:
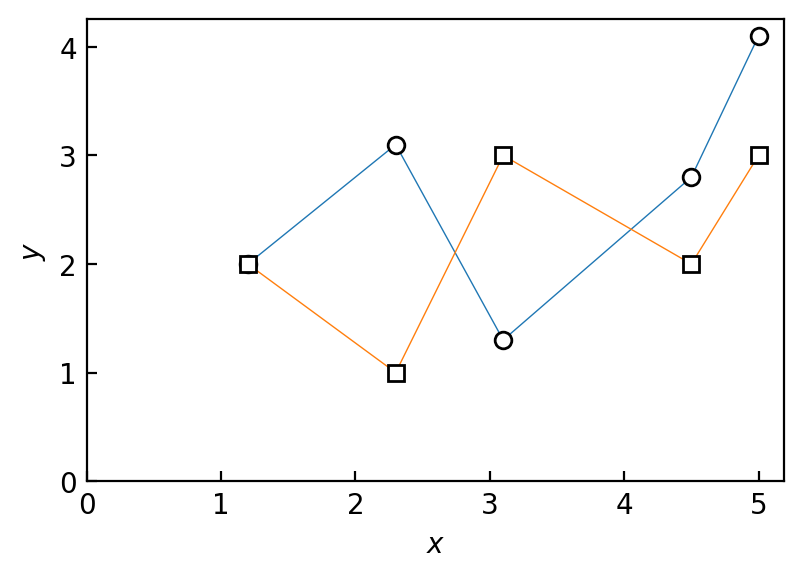
# これは参考までに.

fig2, ax2 = plt.subplots(figsize=(4.5, 3))
ax2.plot(df['x'], df['y'], marker='o', lw=.5, mec='k', mfc='w')

zs = [2, 1, 3, 2, 3]
ax2.plot(df['x'], zs, marker='s', lw=.5, mec='k', mfc='w')

ax2.set_xlim(left=0)
ax2.set_ylim(bottom=0)
ax2.set_xlabel('$x$')
ax2.set_ylabel('$y$')
ax2.tick_params(axis='both', which='both', direction='in')
plt.show()

課題
アカンサスからデータ time_series_example_01.csv をダウンロード
Pandas データフレームとして読み込む.
各カラムの平均と分散を求めて dataframe にする.
Matplotlib で time を横軸, その他を縦軸としてグラフにする.
| ◀ Previous | TOC | Next ▶ |